Developing Business Solutions with the Business Analytics Cycle
Last Updated June 26, 2019

Regardless of your industry or organization’s size, when it comes to applying analytics to find business solutions, the goal is the same—learn from past patterns and performance to improve predictions for the future.
That means working through the full business analytics cycle: capturing, cleaning and analyzing your business’s data; gleaning insights; and using that knowledge to craft proactive business decisions, solve business problems and gain a competitive advantage in the marketplace.
Start your journey through the business analytics cycle:
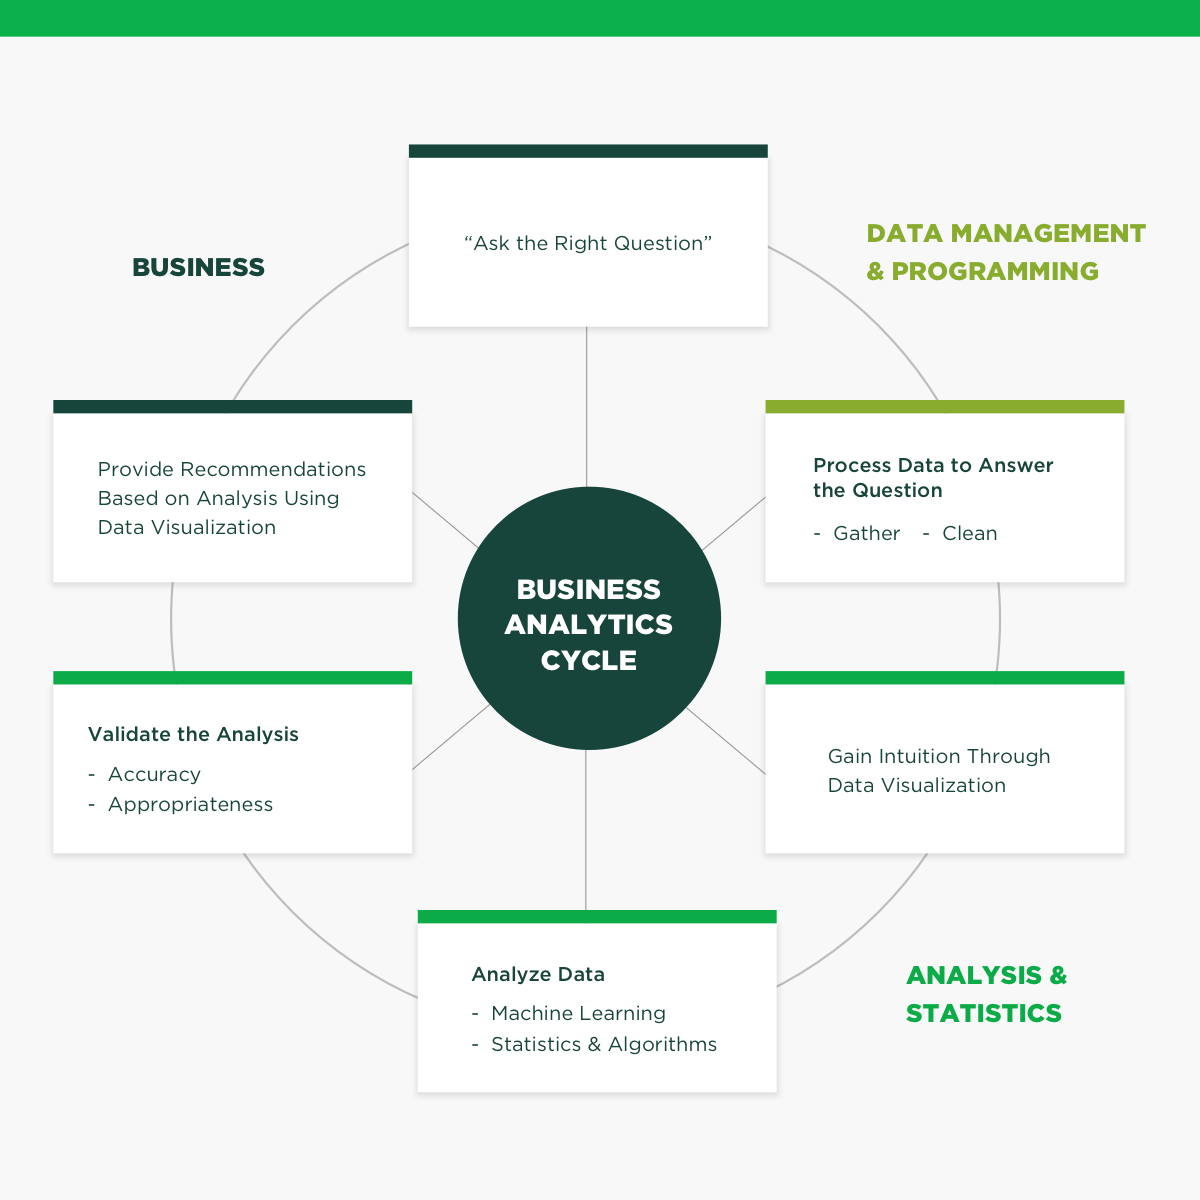
Ask the Right Question
Asking questions helps you define what insight you’re trying to gain, problem you’re trying to solve or larger business goal you’re trying to meet. Asking the right question(s) helps you build the model to collect relevant data. So how do you determine the “right” question to ask?
If, for example, sales of a particular product are flat and your goal is to increase sales by 10% to 15%, you’d want to be sure you’re processing the right sales data to discover the source of your highest and lowest sales. Who within these markets is purchasing the product and how? Have online sales ticked up? Are in-store or same-store purchases flat or in decline? Then…
Process the Data to Answer the Question
The sources and streams of data flowing into your organization are abundant—from email, mobile apps, social networks, e-commerce sites and web traffic—providing information on sales figures, customer engagement, demographic profiles and the overall health of your business. All that data feeds into or is collected and fed into your central data center. Effective data management and programming strategies can help you gather it, clean it and apply it to answer your question.
- Gather: Extract data from your database through advanced queries using Structured Query Language (SQL), which supports, extracts, transforms and loads data in preparation for analytics model development.
- Clean: Data cleaning or cleansing identifies and removes errors, corruptions, inconsistencies or outliers that can affect data accuracy and, ultimately, its functionality.
Visualize and Analyze the Data
Now that you have solid data to work with, it’s time to gain intuition and insight through data visualization and analysis.
Data visualization—presented in statistical graphs, plots, charts or other visual context—descriptively summarizes the information so you can apply the right structured data model for analysis. Specialized analytics systems based on your model can provide the analysis and statistics to start answering your question.
- Statistics and Algorithms: This can include correlation analysis, hypothesis testing, and regression analysis to see whether simple predictions can be made.
- Machine Learning: Decision trees, neural networks and logistics regression are all machine learning-based predictive analytics techniques that can turn data into proactive solutions.
As you go through data analysis, different comparisons can derive different insights (i.e. applying differing machine learning approaches). With enhanced analysis capabilities, you can realize new opportunities and develop innovative solutions to your business questions.
Validate the Analysis
Ready to ask more questions? Examining “Is it accurate?”, “Is it appropriate?” and running “what-if” scenarios will help you determine if your analysis is valid or on the right track.
Statistical analysis, inference and predictive modeling are applied to define and validate target parameters, leading to an optimal solution and model most aligned to your business goal.
Apply It to the Business
This is where all that data starts providing solutions to your business questions. You’ve deepened your insight and understanding and now can start making business recommendations and taking action based on your data analysis, visualization and models.
As you begin to measure outcomes and derive new insights, new questions will arise: “Was the action effective?” “Is a different decision or solution needed?” “What was the return on investment?”
Evaluating appropriateness, managing the value creation of your analytics project, and being able to identify and emphasize the success factors are all critical to leveraging your analytics for a competitive advantage.
Remember, the business analytics cycle is continual. Your data model will need to be updated as the new insights and questions arise, and as your business needs change with new problems to solve and challenges to meet.
Michigan State University’s online Business Analytics Certificate programs cover the entire business analytics cycle, equipping you to turn big data into big solutions for your business.